February 2017

Wednesday, February 15, 2017


28-Days Strength of Concrete in 15 Minutes


Determination of compressive strength of concrete, either accelerated or normal 28-days, takes such a long time that remedial action for defective concrete cannot be under-taken at an early stage. By the time cube strength results indicate low strength, it is too late to do any remedy for the defective concrete which has already set in the form, Further in whole day of concreting work, cubes are filled from only a few batches of concrete which do not actually represent the strength of the entire concrete mass being used in the construction. This shows the limitations of cube strength test for the quality control of concrete.
Analysis of Fresh Concrete
In considering the ingredients of a concrete mix, one assumes that the actual proportions correspond to those specified. If this were in-variably so there would be little need for testing the strength of hardened concrete. However, in practice, mistakes, errors and even deliberate actions can lead to incorrect mix proportions. Therefore it is useful to determine the composition of concrete just discharged from the mixer, so that the defective concrete shall not go for placement. The two values of greatest interest are the cement content and water/cement ratio.
Many methods are available for the analysis of fresh concrete. Most of them are tedious, time consuming and need costly equipment. Naturally these methods are of little use at an ordinary construction site.
Simple Method for Analysis of Fresh Concrete 
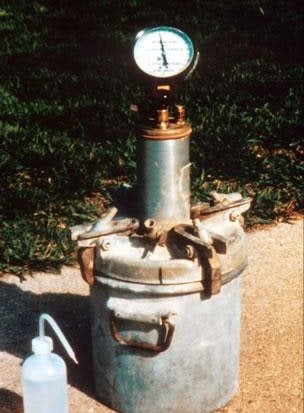
A simple method for the analysis of concrete just discharged from the mixer and then predicting the 28-days strength of concrete in 15 minutes is described. In this method no costly equipment is required and the method is simple for use at construction sites. The only equipment required are an ordinary balance of one Kg capacity with least count of 0.5 gm, a fry pan, a few trays, heater and sieve set. The step by step operations of the method are numerated below.
Step 1. Take about 200 gms of representative dry sample of sand which is going to be used in the concrete. Sieve it through 150 micron IS sieve. Find out percentage of particles passing through this sieve.
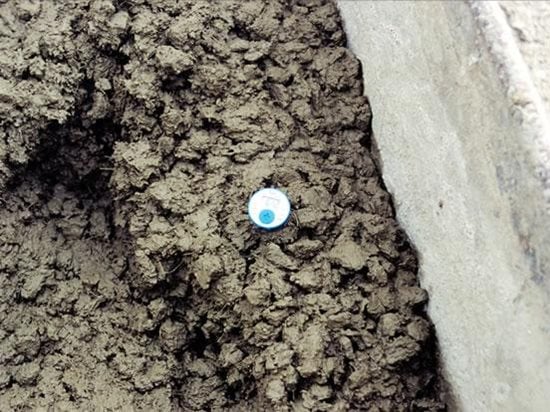
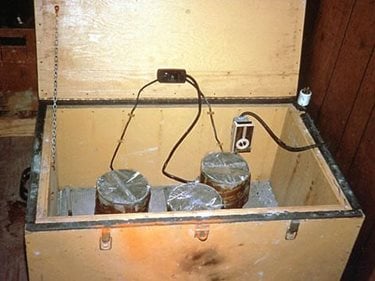
Step 2. Take two representative samples of about one KG each of concrete just discharged from the mixer. All the tests have to be commenced virtually as soon as the concrete has been discharged from the mixer because loss of water can occur; even if evaporation is prevented, an unknown amount of hydration will take place during any period of delay. These two samples are to be weighed accurately. Dry sample No. 1 of concrete on a heater and determine the percentage of water in the sample.
Step 3. Sample No. 2 shall be thoroughly washed by water on 150 micron sieve. The retained material then dried on a heater, cooled and sieved on 4.75 mm sieve. Material retained on 4.75 mm sieve shall be coarse aggregate, whereas passing material on it will be sand-silt. The cement content may be obtained by difference in weights.
fig-1- relation between free water cement ratio and concrete compressive strength
Knowing the absorption of aggregates, total water and cement content, free water/cement ratio may be determined.
Prediction of 28-Days Strength of Concrete
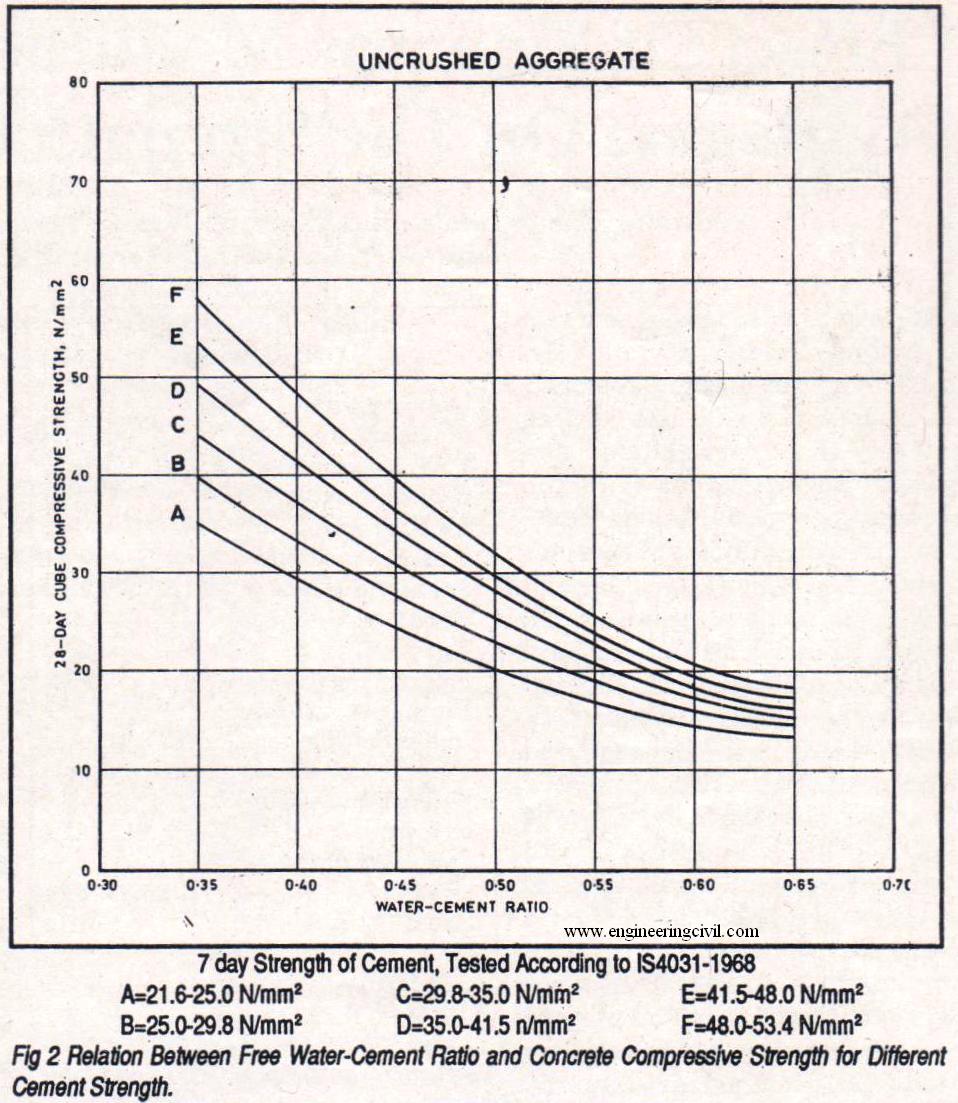
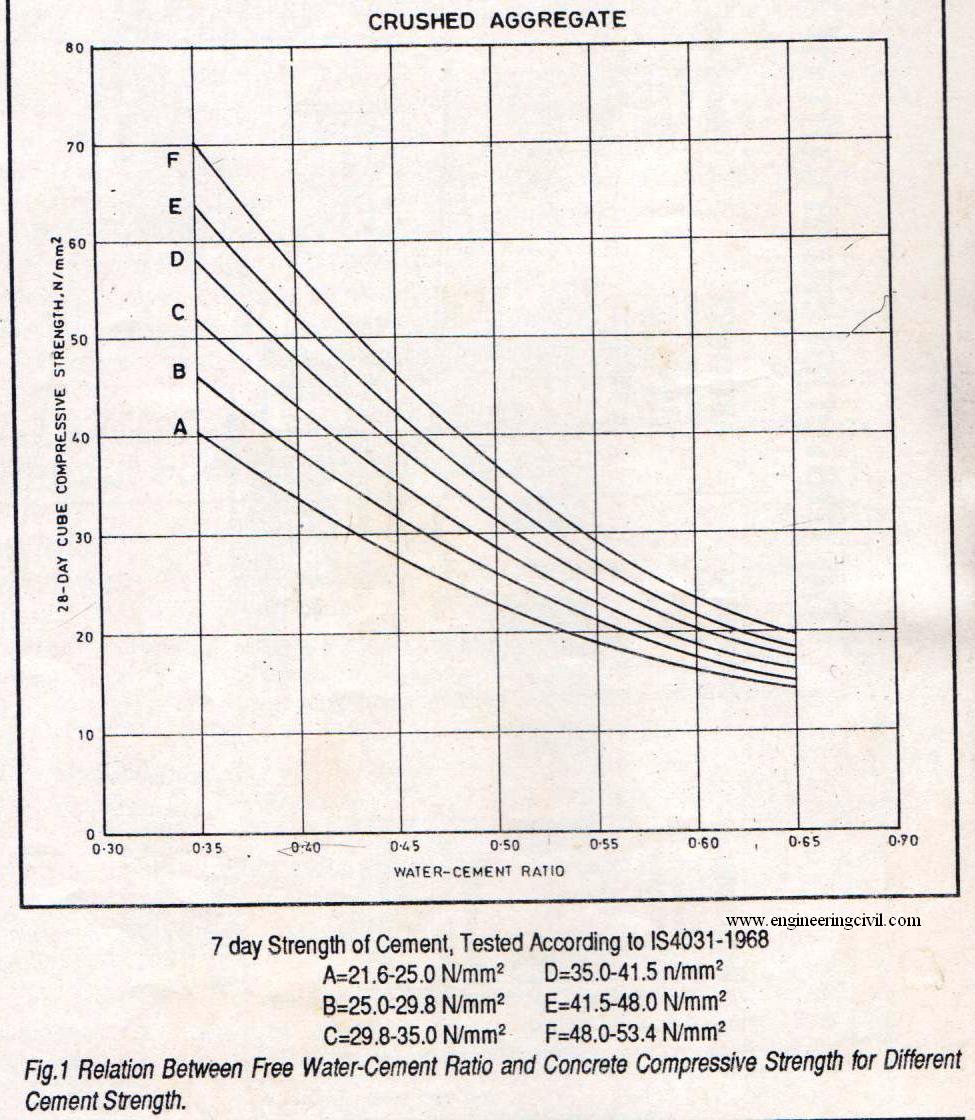
Cement to be used in construction must be tested and sub-standard cement should not be allowed to be used in the structural concrete. By knowing the cement’s 7-days compressive strength and free water/cement ratio, concrete strength may be predicted from Fig. 1 for crushed aggregate and from Fig.2 for uncrushed (natural gravel) aggregate. These figures were developed by the author from Indian materials by numerous trials.
wet analysis of concrete
A Performa for wet analysis of concrete developed by the author is given here in Appendix A with an example of actual trial. The mix in this case was 1:2:4 on the basis of SSD aggregates by weight and free W/C 0.55; 20 mm maximum size crushed aggregate, river sand of Zone II. The water absorption of coarse aggregate and sand in both was 1% and cement’s 7-days compressive strength was 27.5 N/mm2.
Just after the discharge of concrete from the mixer it was analysed as per the method indicated in Appendix A. The mix ratio by weight and on the basis of SSD aggregates was found to be 1:1.96:4.05 and free water/cement ratio of 0.55.
From Fig. 1 the 28-days strength of this mix of free W/C 0.55 and 7-days cement strength of 27.5 N/mm2 (curve B) was predicted 21.0 N/mm2 This prediction was done within 15 minutes after the concrete was discharged from the mixer. On testing the cubes of this mix at 28-days, the strength was obtained as 21.5 N/mm2.
Conclusion
From this simple method of analysis of fresh concrete, every batch of concrete mix may be predicted for 28-days strength just after discharge from the mixer, and any doubtful concrete mix may be discarded. It must be born in mind that prediction of concrete strength alone at mixer or strength obtained by a cube test is not the sole criterion for good quality concrete, as quality also depends upon many factors including proper placing, compaction and curing.
relation between free water cement ratio

Monday, February 6, 2017

TESTS on Fresh CONCRETE


So what tests are typically run (or would be beneficial to conduct) on a smaller-size construction project? Here's a basic checklist:
ASTM C 172Sampling Freshly Mixed Concrete
ASTM C 1064Temperature of Freshly Mixed Concrete
ASTM C 143Slump of Hydraulic-Cement Concrete
ASTM C 231Air Content of Fresh Concrete by the Pressure Method
ASTM C 173Air Content of Fresh Concrete by the Volumetric Method (Roll-o-meter)
ASTM C 138Density (Unit Weight), Yield and Air Content of Concrete
ASTM C 31Making and Curing Concrete Test Specimens in the Field
The list is not as long as it seems. If you work in the concrete industry, your work or your materials are likely to be affected by these test results. Each procedure or test method must be conducted properly and within the required time frame to be comparable. Fresh concrete tests run along with a set of compressive strength cylinders are: slump, air content, unit weight and temperature. Data from these tests is helpful in assessing mix production and consistency in performance. Although sampling and making and curing test specimens are not test methods per se, they are important practices because subsequent tests depend on the manner in which the concrete was sampled and the manner in which the test samples were made.
For more detailed information on these and other test procedures, visit www.astm.org. Another good resource is ACI 214, Recommended Practice for Evaluation of Strength Tests Results of Concrete, available from the American Concrete Institute.


Sampling (per ASTM C 172) is the first step in determining if the concrete placed complies with specifications. The guidelines are to take composite samples of sufficient total volume (1 ft3 minimum) from the ready-mix truck after 10% and before 90% of the load has been discharged. These samples must be taken no more than 15 minutes apart and remixed to yield a composite sample. They are then covered to protect against rapid evaporation and to avoid contamination.


Here, the temperature is being taken after concrete placement, but ideally it should be taken prior to placement to respond to temperatures outside of a specified range. The thermometer is placed to provide at least 3 inches of concrete around the
inserted stem and left in place a minimum of 2 minutes and until the temperature has stabilized.
Start taking temperature measurements of the concrete (per ASTM C 1064) within 5 minutes after securing the remixed composite. The thermometer should be accurate to 1° F. The concrete should be in a wheelbarrow or other suitable receptacle that will permit insertion of the thermometer so that at least 3 inches of concrete surrounds the stem. As long as sufficient concrete surrounds the thermometer in your sample, it should remain inserted for a minimum of 2 minutes while all the other tests are being conducted. After the 2 minutes elapse, the test is complete once the reading remains stable to within 1° F.
Temperature measurements can also be taken in the transporting vehicle or within the forms as long as 3 inches of concrete surround the thermometer. Measuring concrete temperature in the forms (see photo) is not really a recommended practice since the "toothpaste" is already out of the tube. But if the measurement was missed in the rush of getting everything else done, taking the measurement post-placem


Slump tests (ASTM C 143) are applicable for concrete with slumps greater than 1/2 inch and less than 9 inches. Once the concrete sample has been remixed, start taking the slump tests within 5 minutes. Start by filling a mold 12 inches high in the shape of the frustum of a cone that is 8 inches in diameter at the bottom and 4 inches in diameter at the top. Fill the mold in three equal layers by volume, not by height. Rod each layer 25 times with a bullet-tipped 5/8-inch diameter rod to compact each layer. After filling and rodding, raise the cone to allow the concrete to subside. The distance the concrete subsides, or slumps, is based on its consistency.
Measure the amount the concrete slumps or settles from the original height of 12 inches to the nearest 1/4 inch and record as the slump in inches. The measurement is made between the original height of 12 inches and the displaced center of the settled mass of the demolded concrete. If the test falls outside of the specified range, a check test is typically performed to confirm test results.
Testing tip: Since concrete setting is time and temperature dependent, this test must be started within 5 minutes after obtaining the composite sample and completed within 2 ½ minutes after the filling process begins.

Test cylinders (ASTM C 31) are cast to verify the specified compressive strength of the mix has been achieved. Typically 6-inch-diameter by 12-inch-tall plastic molds are used. Some projects use 4-inch-diameter by 8-inch-high cylinders.
Fill the 6-inch-diameter molds in three equal layers, rodding each layer 25 times. (Fill 4-inch-diameter molds in two equal lifts.) After rodding each layer, tap the outside of the mold to remove any remaining air voids. Once the mold is filled, strike off the top layer of the concrete with the top of the mold and store the molds at temperatures of 60-80°F, leaving them undisturbed. Good field practice would be to place the set of test cylinders in a cure box (shown here) until it is picked up and brought to a lab for curing until the date of testing. Typically a set of four cylinders are cast, with two tested at 7 days and two tested at 28 days. Specifications can, of course, call for other test dates as needed.

A cure box on a level surface with temperature control is ideal for keeping cylinders within the proper temperature range (60-80°F) prior to pickup, up to 48 hours after casting. (Photo courtesy of PCA.)
 
Leaving test cylinders in the sun for too long will cause problems later. Cylinders should be placed on a level surface and protected from the elements for up to the first 48 hours, with the tops covered to prevent moisture loss.
Testing tip: Test cylinders that are poorly made, stored, or neglected will cause headaches and may result in the need for costly hardened concrete testing, all to provide the owner information proving that the actual in-place concrete is of sufficient strength and durability. While this procedure is simple, do not take it lightly. There are a number of reasons why cylinder strengths might be compromised by poor practice, as shown in this table "Effects of Selected Testing Errors".


A Type B pressure meter is used to determine the air content of normal-weight concrete. The air content is read at the dial, which is calibrated for each apparatus. The aggregate correction factor (explained in ASTM C 231) must be subtracted from your reading to obtain the net air content. (Photo courtesy of PCA.
Air-entrained concrete is typically specified in areas of the country where frost-related damage can occur. The measurement of air content in fresh concrete of normal density is typically performed using the pressure method (ASTM C 231). Another useful test is ASTM C 173. However, the pressure method is frequently preferred because it is relatively fast.
You should begin the test within 15 minutes after obtaining the composite sample. Start by filling the 0.25 ft3 base of the air-content test device in three equal layers, and rod each layer 25 times. After rodding, strike the outside of the base with a mallet 12 to 15 times to close any air voids. After completing the three equal layers, strike off the bowl flush at the top to completely fill the 0.25 ft3 volume. At this point, it can be weighed as part of the calculation to determine the fresh concrete unit weight.
Next, latch the top of the air-content test device over the base and fill the air gap between the top of the struck-off concrete and the underside of the top of air meter with water. The meter top is then pressurized with the built-in hand pump until zeroed out (or as calibrated). After a stabilization period, release the pressure in the top and read the air-void content on the dial on the top of the meter. Subtract the aggregate correction factor from the dial reading and report the final value.
Testing tip: A typical air content for concrete with a ¾-inch maximum-size aggregate is about 6%, and specified ranges in air content are typically minus 1 ½% and plus 1 ½% of the target value.


The density (unit weight) of concrete (ASTM C 138) is measured using a Type B pressure meter (see photo) to verify agreement with the approved project mix design. The information obtained through this test can also be used to determine yield and relative yield, which helps you verify that you are getting the volume of concrete you ordered and paid for. You can also use this data to calculate the air content of the mix.
The unit weight is determined by the formula below. Subtract the weight of the measuring base from the combined weight of the measuring base and the concrete it contains. Next, divide this weight (in pounds) by the volume of the measuring base (cubic feet) to obtain the density expressed as lb/ft3:
D = (Mc – Mm) / Vm
D=Density of the concrete, lb/ft3
Mc=Weight of the measure holding the concrete
Mm=Weight of the empty concrete measure (base of air meter)
Vm=Volume of the measure (usually about 0.25 ft3 for a pressure meter base) (Fig. 3)
Testing tip: Having the unit weight data gives you "a third point to check a straight line." For example, when slump increases, the air content will generally increase. If significant, look for the unit weight to decrease measurably. If that is not reflected in the test results, keep an eye on the testing and examine the data, procedures, or reporting accuracy.

Condition% ReductionEffect at 10,000 psi
Rough ends before capping277300
Reuse of plastic molds227800
Use of cardboard molds217900
Convex end, capped128800
Eccentric loading128800
Out-of-round diameter109000
Ends not perpendicular to axis89200
Thick cap69400
Sloped end leveled by cap59500
Chipped cap49600
Rebar rodding29800
1 day at 100°F/27 in lab cure118900
3 days at 100°F/24 in lab cure227800
7 days at 100°F/21 in lab cure267400
1 day air/27 days moist89200
3 days air/24 days moist118900
7 days air/21 days moist188200
*NRMCA Publication No. 179
Various improper testing practices can cause strength reductions in test cylinders as demonstrated in this National Ready Mix Concrete Association table. Assuming a 10,000-psi mix strength, the reduction in compressive strength is shown for numerous situations where cylinders where not properly cast, stored, or prepared for testing.

Sunday, February 5, 2017

Marshall Mix Design


The basic concepts of the Marshall mix design method were originally developed by Bruce Marshall of the Mississippi Highway Department around 1939 and then refined by the U.S. Army. Currently, the Marshall method is used in some capacity by about 38 states. The Marshall method seeks to select the asphalt binder content at a desired density that satisfies minimum stability and range of flow values


This section consists of a brief history of the Marshall mix design method followed by a general outline of the actual method. This outline emphasizes general concepts and rationale over specific procedures. Detailed procedures vary from state-to-state but typical procedures are available in the following documents:
  • Roberts, F.L.; Kandhal, P.S.; Brown, E.R.; Lee, D.Y. and Kennedy, T.W. (1996[2]). Hot Mix Asphalt Materials, Mixture Design, and Construction. National Asphalt Pavement Association Education Foundation. Lanham, MD.
  • National Asphalt Pavement Association. (1982[3]). Development of Marshall Procedures for Designing Asphalt Paving Mixtures, Information Series 84. National Asphalt Pavement Association. Lanham, MD.
  • Asphalt Institute. (1997[4]). Mix Design Methods for Asphalt, 6th ed., MS-02. Asphalt Institute. Lexington, KY.

Marshall Method History

(from White, 1985[1])
During World War II, the U.S. Army Corps of Engineers (USCOE) began evaluating various HMA mix design methods for use in airfield pavement design. Motivation for this search came from the ever-increasing wheel loads and tire pressures produced by larger and larger military aircraft. Early work at the U.S. Army Waterways Experiment Station (WES) in 1943 had the objective of developing:
“…a simple apparatus suitable for use with the present California Bearing Ratio (CBR) equipment to design and control asphalt paving mixtures…”
The most promising method eventually proved to be the Marshall Stability Method developed by Bruce G. Marshall at the Mississippi Highway Department in 1939. WES took the original Marshall Stability Test and added a deformation measurement (using a flow meter) that was reasoned to assist in detecting excessively high asphalt contents. This appended test was eventually recommended for adoption by the U.S. Army because:
  1. It was designed to stress the entire sample rather than just a portion of it.
  2. It facilitated rapid testing with minimal effort.
  3. It was compact, light and portable.
  4. It produced densities reasonably close to field densities.
WES continued to refine the Marshall method through the 1950s with various tests on materials, traffic loading and weather variables. Today the Marshall method, despite its shortcomings, is probably the most widely used mix design method in the world. It has probably become so widely used because (1) it was adopted and used by the U.S. military all over the world during and after WWII and (2) it is simple, compact and inexpensive.

Marshall Mix Design Procedure

The Marshall mix design method consists of 6 basic steps:
  1. Aggregate selection.
  2. Asphalt binder selection.
  3. Sample preparation (including compaction).
  4. Stability determination using the Hveem Stabilometer.
  5. Density and voids calculations.
  6. Optimum asphalt binder content selection.

Aggregate Selection

Although Hveem did not specifically develop an aggregate evaluation and selection procedure, one is included here because it is integral to any mix design. A typical aggregate evaluation for use with either the Hveem or Marshall mix design methods includes three basic steps (Roberts et al., 1996[2]):
  1. Determine aggregate physical properties. This consists of running various tests to determine properties such as:
  2. Determine other aggregate descriptive physical properties. If the aggregate is acceptable according to step #1, additional tests are run to fully characterize the aggregate. These tests determine:
  3. Perform blending calculations to achieve the mix design aggregate gradation. Often, aggregates from more than one source or stockpile are used to obtain the final aggregate gradation used in a mix design. Trial blends of these different gradations are usually calculated until an acceptable final mix design gradation is achieved. Typical considerations for a trial blend include:
    • All gradation specifications must be met. Typical specifications will require the percent retained by weight on particular sieve sizes to be within a certain band.
    • The gradation should not be too close to the FHWA’s 0.45 power maximum density curve. If it is, then the VMA is likely to be too low. Gradation should deviate from the FHWA’s 0.45 power maximum density curve, especially on the 2.36 mm (No. 8) sieve.

Asphalt Binder Evaluation

The Marshall test does not have a common generic asphalt binder selection and evaluation procedure.  Each specifying entity uses their own method with modifications to determine the appropriate binder and, if any, modifiers.  Binder evaluation can be based on local experience, previous performance or a set procedure.  The most common procedure is the Superpave PG binder system. Once the binder is selected, several preliminary tests are run to determine the asphalt binder’s temperature-viscosity relationship.

Sample Preparation

The Marshall method, like other mix design methods, uses several trial aggregate-asphalt binder blends (typically 5 blends with 3 samples each for a total of 15 specimens), each with a different asphalt binder content.  Then, by evaluating each trial blend’s performance, an optimum asphalt binder content can be selected.  In order for this concept to work, the trial blends must contain a range of asphalt contents both above and below the optimum asphalt content.  Therefore, the first step in sample preparation is to estimate an optimum asphalt content.  Trial blend asphalt contents are then determined from this estimate.

Optimum Asphalt Binder Content Estimate

The Marshall mix design method can use any suitable method for estimating optimum asphalt content and usually relies on local procedures or experience.

Sample Asphalt Binder Contents

Based on the results of the optimum asphalt binder content estimate, samples are typically prepared at 0.5 percent by weight of mix increments, with at least two samples above the estimated asphalt binder content and two below.

Compaction with the Marshall Hammer

Each sample is then heated to the anticipated compaction temperature and compacted with a Marshall hammer, a device that applies pressure to a sample through a tamper foot (Figure 1).  Some hammers are automatic and some are hand operated.  Key parameters of the compactor are:
  • Sample size = 102 mm (4-inch) diameter cylinder 64 mm (2.5 inches) in height (corrections can be made for different sample heights)
  • Tamper foot = Flat and circular with a diameter of 98.4 mm (3.875 inches) corresponding to an area of 76 cm2 (11.8 in2).
  • Compaction pressure = Specified as a 457.2 mm (18 inches) free fall drop distance of a hammer assembly with a 4536 g (10 lb.) sliding weight.
  • Number of blows = Typically 35, 50 or 75 on each side depending upon anticipated traffic loading.
  • Simulation method = The tamper foot strikes the sample on the top and covers almost the entire sample top area.  After a specified number of blows, the sample is turned over and the procedure repeated.

Figure 1. Marshall drop hammers.
The standard Marshall method sample preparation procedure is contained in:
  • AASHTO T 245: Resistance to Plastic Flow of Bituminous Mixtures Using the Marshall Apparatus

The Marshall Stability and Flow Test

The Marshall stability and flow test provides the performance prediction measure for the Marshall mix design method. The stability portion of the test measures the maximum load supported by the test specimen at a loading rate of 50.8 mm/minute (2 inches/minute). Basically, the load is increased until it reaches a maximum then when the load just begins to decrease, the loading is stopped and the maximum load is recorded.
During the loading, an attached dial gauge measures the specimen’s plastic flow as a result of the loading (Figure 2). The flow value is recorded in 0.25 mm (0.01 inch) increments at the same time the maximum load is recorded.

Figure 2. Marshall stability testing apparatus.
Typical Marshall design stability and flow criteria are shown in Table 1.
Table 1. Typical Marshall Design Criteria (from Asphalt Institute, 1979[5])
Mix CriteriaLight Traffic
(< 104 ESALs)
Medium Traffic
(104 – 106 ESALs)
Heavy Traffic
(> 106 ESALs)
Min.Max.Min.Max.Min.Max.
Compaction 
(number of blows on each end of the sample)
355075
Stability (minimum)2224 N
(500 lbs.)
3336 N
(750 lbs.)
6672 N
(1500 lbs.)
Flow (0.25 mm (0.01 inch))820818816
Percent Air Voids353535
One standard Marshall mix design procedure is:
  • AASHTO T 245: Resistance to Plastic Flow of Bituminous Mixtures Using Marshall Apparatus

Density and Voids Analysis

All mix design methods use density and voids to determine basic HMA physical characteristics. Two different measures of densities are typically taken:
  1. Bulk specific gravity (Gmb).
  2. Theoretical maximum specific gravity (TMD, Gmm).
These densities are then used to calculate the volumetric parameters of the HMA. Measured void expressions are usually:
Generally, these values must meet local or State criteria.
Table 2. Typical Marshall Minimum VMA
(from Asphalt Institute, 1979[5])
Nominal Maximum
Particle Size
Minimum VMA (percent)
(mm)(U.S.)
632.5 inch11
502.0 inch11.5
37.51.5 inch12
25.01.0 inch13
19.00.75 inch14
12.50.5 inch15
9.50.375 inch16
4.75No. 4 sieve18
2.36No. 8 sieve21
1.18No. 16 sieve23.5

Selection of Optimum Asphalt Binder Content

The optimum asphalt binder content is finally selected based on the combined results of Marshall stability and flow, density analysis and void analysis (Figure 3).  Optimum asphalt binder content can be arrived at in the following procedure (Roberts et al., 1996[2]):
  1. Plot the following graphs:
    • Asphalt binder content vs. density.  Density will generally increase with increasing asphalt content, reach a maximum, then decrease.  Peak density usually occurs at a higher asphalt binder content than peak stability.
    • Asphalt binder content vs. Marshall stability.  This should follow one of two trends:
    • * Stability increases with increasing asphalt binder content, reaches a peak, then decreases.
    • * Stability decreases with increasing asphalt binder content and does not show a peak.  This curve is common for some recycled HMA mixtures.
    • Asphalt binder content vs. flow.
    • Asphalt binder content vs. air voids.  Percent air voids should decrease with increasing asphalt binder content.
    • Asphalt binder content vs. VMA.  Percent VMA should decrease with increasing asphalt binder content, reach a minimum, then increase.
    • Asphalt binder content vs. VFA.  Percent VFA increases with increasing asphalt binder content.
  2. Determine the asphalt binder content that corresponds to the specifications median air void content (typically this is 4 percent).  This is the optimum asphalt binder content.
  3. Determine properties at this optimum asphalt binder content by referring to the plots.  Compare each of these values against specification values and if all are within specification, then the preceding optimum asphalt binder content is satisfactory.  Otherwise, if any of these properties is outside the specification range the mixture should be redesigned.
Figure 3. Selection of optimum asphalt binder content example (from Roberts et al., 1996[2]).


Footnotes
  1. Marshall Procedures for Design and Quality Control of Asphalt Mixtures.  Asphalt Paving Technology: Proceedings, vol. 54.  Association of Asphalt Paving Technologists Technical Sessions, 11-13 February 1985.  San Antonio, TX.  pp. 265-284.
  2. Hot Mix Asphalt Materials, Mixture Design, and Construction.  National Asphalt Pavement Association Education Foundation.  Lanham, MD.
  3. National Asphalt Pavement Association. (1982). Development of Marshall Procedures for Designing Asphalt Paving Mixtures, Information Series 84. National Asphalt Pavement Association. Lanham, MD.
  4. Mix Design Methods for Asphalt, 6th ed., MS-02. Asphalt Institute. Lexington, KY.
  5. Mix Design Methods for Asphalt Concrete and Other Hot-Mix Types.  Manual Series No. 2 (MS-2).  Asphalt Institute.  Lexington, KY.

ACI Mix Design (Concrete)


The American Concrete Institute (ACI) mix design method is but one of many basic concrete mix design methods available today. This section summarizes the ACI absolute volume method because it is widely accepted in the U.S. and continually updated by the ACI. Keep in mind that this summary and most methods designated as “mix design” methods are really just mixture proportioning methods. Mix design includes trial mixture proportioning (covered here) plus performance tests.
This section is a general outline of the ACI proportioning method with specific emphasis on PCC for pavements. It emphasizes general concepts and rationale over specific procedures. Typical procedures are available in the following documents:
  • The American Concrete Institute’s (ACI) Standard Practice for Selecting Proportions for Normal, Heavyweight, and Mass Concrete (ACI 211.1-91) as found in their ACI Manual of Concrete Practice 2000, Part 1: Materials and General Properties of Concrete.
  • The Portland Cement Association’s (PCA) Design and Control of Concrete Mixtures, 14th edition (2002) or any earlier edition.
The standard ACI mix design procedure can be divided up into 8 basic steps:
  1. Choice of slump
  2. Maximum aggregate size selection
  3. Mixing water and air content selection
  4. Water-cement ratio
  5. Cement content
  6. Coarse aggregate content
  7. Fine aggregate content
  8. Adjustments for aggregate moisture

Slump

The choice of slump is actually a choice of mix workability. Workability can be described as a combination of several different, but related, PCC properties related to its rheology:
  • Ease of mixing
  • Ease of placing
  • Ease of compaction
  • Ease of finishing
Generally, mixes of the stiffest consistency that can still be placed adequately should be used (ACI, 2000[1]). Typically slump is specified, but Table 1 shows general slump ranges for specific applications. Slump specifications are different for fixed form paving and slip form paving. Table 2 shows typical and extreme state DOT slump ranges.
Table 1. Slump Ranges for Specific Applications (after ACI, 2000[1])
Type of ConstructionSlump
(mm)(inches)
Reinforced foundation walls and footings25 – 751 – 3
Plain footings, caissons and substructure walls25 – 751 – 3
Beams and reinforced walls25 – 1001 – 4
Building columns25 – 1001 – 4
Pavements and slabs25 – 751 – 3
Mass concrete25 – 501 – 2

Table 2. Typical State DOT Slump Specifications
(data taken from ACPA, 2001[2])
SpecificationsFixed FormSlip Form
(mm)(inches)(mm)(inches)
Typical25 – 751 – 30 – 750 – 3
Extremesas low as 25
as high as 175
as low as 1
as high as 7
as low as 0
as high as 125
as low as 0
as high as 5

Maximum Aggregate Size

Maximum aggregate size will affect such PCC parameters as amount of cement paste, workability and strength. In general, ACI recommends that maximum aggregate size be limited to 1/3 of the slab depth and 3/4 of the minimum clear space between reinforcing bars. Aggregate larger than these dimensions may be difficult to consolidate and compact resulting in a honeycombed structure or large air pockets. Pavement PCC maximum aggregate sizes are on the order of 25 mm (1 inch) to 37.5 mm (1.5 inches) (ACPA, 2001[2]).

Mixing Water and Air Content Estimation

Slump is dependent upon nominal maximum aggregate size, particle shape, aggregate gradation, PCC temperature, the amount of entrained air and certain chemical admixtures. It is not generally affected by the amount of cementitious material. Therefore, ACI provides a table relating nominal maximum aggregate size, air entrainment and desired slump to the desired mixing water quantity. Table 3 is a partial reproduction of ACI Table 3 (keep in mind that pavement PCC is almost always air-entrained so air-entrained values are most appropriate). Typically, state agencies specify between about 4 and 8 percent air by total volume (based on data from ACPA, 2001[2]).
Note that the use of water-reducing and/or set-controlling admixtures can substantially reduce the amount of mixing water required to achieve a given slump.
Table 3. Approximate Mixing Water and Air Content Requirements for Different Slumps and Maximum Aggregate Sizes (adapted from ACI, 2000[1])
SlumpMixing Water Quantity in kg/m3 (lb/yd3) for the listed Nominal Maximum Aggregate Size
9.5 mm
(0.375 in.)
12.5 mm
(0.5 in.)
19 mm
(0.75 in.)
25 mm
(1 in.)
37.5 mm
(1.5 in.)
50 mm
(2 in.)
75 mm
(3 in.)
100 mm
(4 in.)
Non-Air-Entrained PCC
25 – 50
(1 – 2)
207
(350)
199
(335)
190
(315)
179
(300)
166
(275)
154
(260)
130
(220)
113
(190)
75 – 100
(3 – 4)
228
(385)
216
(365)
205
(340)
193
(325)
181
(300)
169
(285)
145
(245)
124
(210)
150 – 175
(6 – 7)
243
(410)
228
(385)
216
(360)
202
(340)
190
(315)
178
(300)
160
(270)
Typical entrapped air
(percent)
32.521.510.50.30.2
Air-Entrained PCC
25 – 50
(1 – 2)
181
(305)
175
(295)
168
(280)
160
(270)
148
(250)
142
(240)
122
(205)
107
(180)
75 – 100
(3 – 4)
202
(340)
193
(325)
184
(305)
175
(295)
165
(275)
157
(265)
133
(225)
119
(200)
150 – 175
(6 – 7)
216
(365)
205
(345)
197
(325)
184
(310)
174
(290)
166
(280)
154
(260)
Recommended Air Content (percent)
Mild Exposure4.54.03.53.02.52.01.51.0
Moderate Exposure6.05.55.04.54.54.03.53.0
Severe Exposure7.57.06.06.05.55.04.54.0

Water-Cement Ratio

The water-cement ratio is a convenient measurement whose value is well correlated with PCC strength and durability. In general, lower water-cement ratios produce stronger, more durable PCC. If natural pozzolans are used in the mix (such as fly ash) then the ratio becomes a water-cementitious material ratio (cementitious material = portland cement + pozzolanic material). The ACI method bases the water-cement ratio selection on desired compressive strength and then calculates the required cement content based on the selected water-cement ratio. Table 4 is a general estimate of 28-day compressive strength vs. water-cement ratio (or water-cementitious ratio). Values in this table tend to be conservative (ACI, 2000[1]). Most state DOTs tend to set a maximum water-cement ratio between 0.40 – 0.50 (based on data from ACPA, 2001[2]).
Table 4. Water-Cement Ratio and Compressive Strength Relationship
(after ACI, 2000[1])
28-Day Compressive Strength in MPa (psi)Water-cement ratio by weight
Non-Air-EntrainedAir-Entrained
41.4 (6000)0.41
34.5 (5000)0.480.40
27.6 (4000)0.570.48
20.7 (3000)0.680.59
13.8 (2000)0.820.74

Cement Content

Cement content is determined by comparing the following two items:
  • The calculated amount based on the selected mixing water content and water-cement ratio.
  • The specified minimum cement content, if applicable. Most state DOTs specify minimum cement contents in the range of 300 – 360 kg/m3 (500 – 600 lbs/yd3).
An older practice used to be to specify the cement content in terms of the number of 94 lb. sacks of portland cement per cubic yard of PCC. This resulted in specifications such as a “6 sack mix” or a “5 sack mix”. While these specifications are quite logical to a small contractor or individual who buys portland cement in 94 lb. sacks, they do not have much meaning to the typical pavement contractor or batching plant who buys portland cement in bulk. As such, specifying cement content by the number of sacks should be avoided.

Coarse Aggregate Content

Selection of coarse aggregate content is empirically based on mixture workability. ACI recommends the percentage (by unit volume) of coarse aggregate based on nominal maximum aggregate size and fine aggregate fineness modulus. This recommendation is based on empirical relationships to produce PCC with a degree of workability suitable for usual reinforced construction (ACI, 2000[1]). Since pavement PCC should, in general, be more stiff and less workable, ACI allows increasing their recommended values by up to about 10 percent. Table 5 shows ACI recommended values.
Table 5. Volume of Coarse Aggregate per Unit Volume of PCC
for Different Fine aggregate Fineness Moduli for Pavement PCC (after ACI, 2000[1])
Nominal Maximum Aggregate SizeFine Aggregate Fineness Modulus
2.402.602.803.00
9.5 mm (0.375 inches)0.500.480.460.44
12.5 mm (0.5 inches)0.590.570.550.53
19 mm (0.75 inches)0.660.640.620.60
25 mm (1 inches)0.710.690.670.65
37.5 mm (1.5 inches)0.750.730.710.69
50 mm (2 inches)0.780.760.740.72
Notes:
  1. These values can be increased by up to about 10 percent for pavement applications.
  2. Coarse aggregate volumes are based on oven-dry-rodded weights obtained in accordance with ASTM C 29.

Fine Aggregate Content

At this point, all other constituent volumes have been specified (water, portland cement, air and coarse aggregate). Thus, the fine aggregate volume is just the remaining volume:
--Unit volume (1 m3 or yd3)
Volume of mixing water
Volume of air
Volume of portland cement
Volume of coarse aggregate
=Volume of fine aggregate

Adjustments for Aggregate Moisture

Unlike HMA, PCC batching does not require dried aggregate. Therefore, aggregate moisture content must be accounted for. Aggregate moisture affects the following parameters:
  1. Aggregate weights. Aggregate volumes are calculated based on oven dry unit weights, but aggregate is typically batched based on actual weight. Therefore, any moisture in the aggregate will increase its weight and stockpiled aggregates almost always contain some moisture. Without correcting for this, the batched aggregate volumes will be incorrect.
  2. Amount of mixing water. If the batched aggregate is anything but saturated surface dry it will absorb water (if oven dry or air dry) or give up water (if wet) to the cement paste. This causes a net change in the amount of water available in the mix and must be compensated for by adjusting the amount of mixing water added.